How to Save a Custom Chart on the Navigator Charting Page
Custom charts can be made and saved based on several reports within the system. Use this button  to create custom charts where this feature is available.
In the following example, we will use the Statement of Revenues and Expenditures. First, you must create a custom chart.
- Go to Reports>Financial Statements>Statement of Revenues and Expenditures.
- Select a report from the Report Name drop-down list.
- Click the Create Chart button
 .
. - Enter a Chart Name and then the settings for the chart.
- Save your changes.
- Close the organization and re-open it to apply the changes (File>Close/Open Organization).
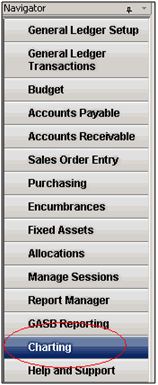
- Go to Navigator>Charting>Process Manager>Charts tab. Your custom chart is now available in the Process Manager window>Charts tab.
- If the Navigator is not open, go to the View menu and select Navigator.
- If you still do not see the Process Manager window, go to the View menu and select Process Manager.
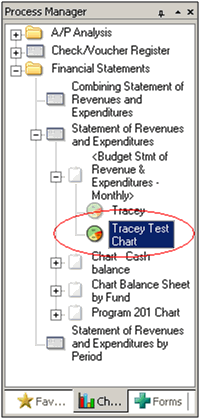
- Within the Process Manager>Charts tab there will be a chart icon that represents the custom charts that you have developed.
- Right-click one of the chart icons and select “Apply to Charting Task Window.”
- Close the organization and re-open it to apply the changes (File>Close/Open Organization).
- Go to Navigator>Charting to view the chart. (You can always view a custom chart by double-clicking on it in the Process Manager>Charts tab.)