Trend Analysis | Net Income Year over Year
The Trend Analysis chart compares your organization's net income month by month across the current fiscal year and the two previous years. The net income is calculated as revenue minus expenses for each period. Hover over a line in the line chart to view the amounts across three years. Select a point in the line chart to display the amounts in the grid for all three years.
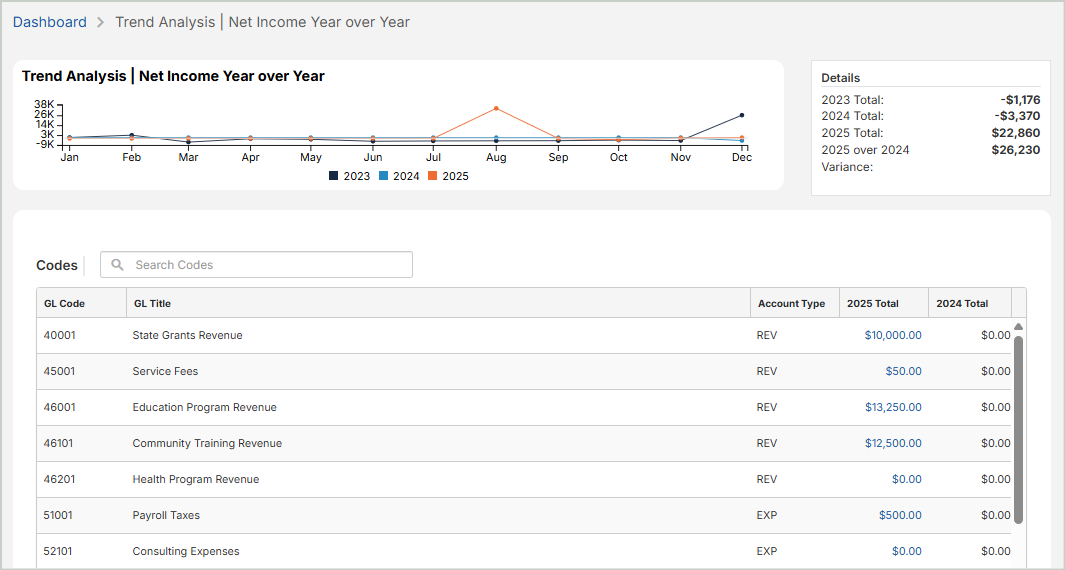
Details
Previous Year Total: The total net income for the previous fiscal year
Current Year Total: The total net income for the current fiscal year
Next Year Total: The projected total net income for the next fiscal year
Next Year over Current Year Variance: The projected difference between the next year and the current year
Codes
To search for a specific GL code, enter the code into the search box at the upper left corner of the grid. All the transactions that match will display in the grid.
GL Code: The ID associated with Revenue and Expense account types
GL Title: The title assigned to the GL code
Account Type: The General Ledger type segment code designation of EXP (Expense) or REV (Revenue)
Current Year Total: The total amount (expense or revenue) in the current fiscal year for the GL code. Select a Total to view its details.
Next Year Total: The projected total amount (expense or revenue) in the next fiscal year for the GL code
Previous Year Total: The total amount (expense or revenue) in the previous fiscal year for the GL code
Trend Analysis | Net Income Year over Year - <Month>
At the bottom of the page, the system displays a snapshot of the net income for the selected month, year over year.
Previous Year Total: The total net income for this month in the previous fiscal year
Current Year Total: The total net income for this month in the current fiscal year
Next Year Total: The projected total net income for this month in the next fiscal year
Next Year over Current Year Variance: The difference between the Previous Year Total and the Current Year Total for this month
View Details for the Current Year
Select a Total from the grid above to view details for the current year.
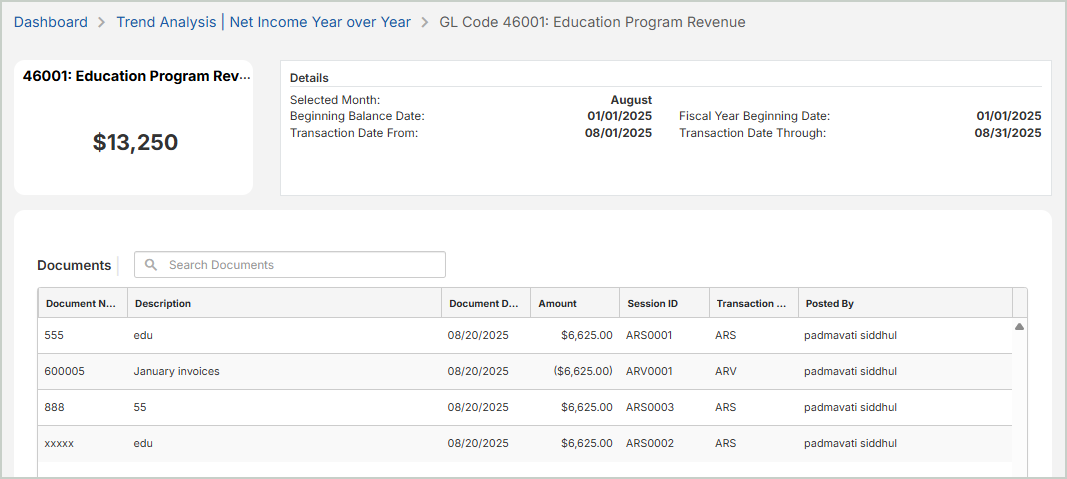
Details
Selected Month: The month that was selected on the previous page
Beginning Balance Date: The beginning date of an accounting period
Fiscal Year Beginning Date: The first day of the fiscal year for which you're entering transactions
Transaction Date From: The start date of the month for the transaction
Transaction Date Through: The date of actual transactions through the current date (the date you log in to the system) when you're viewing the current month. Otherwise, it specifies the end of the month date for the selected period.
Documents
To search for a specific document, enter the document number into the search box.
Document Number: The number assigned to the document. Select a Document Number to view the transactions entered for the document.
Description: The description of the document
Document Date: The invoice, credit, or receipt date entered on the transaction document
Amount: The amount displayed on the document
Session ID: The session ID assigned to the batch of documents
Transaction Source: The transaction type for the document, such as APC, CD, or JVA
Posted By: The user who posted the document
Posted Date: The date the document was posted
Trend Analysis | Net Income Year over Year - GL Code
At the bottom of the page, the system displays a snapshot of net income year over year for the selected GL code.
Beginning Balance: The total balance at the beginning of an accounting period
Debit Total: The total amount of all debit transactions
Credit Total: The total amount of all credit transactions
Ending Balance: This balance is calculated by taking the Beginning Balance and applying the current activity (Debit Totals and Credit Totals).